Annex 2: How we profile risk
The term risk can mean different things to different people and can often be used in a range of ways. We follow the definition that has been researched and recommended by the National Fire Chiefs Council Community Risk Project (https://www.ukfrs.com/community-risk/defining-risk).
All fire services, by law, have to assess risks in their areas. To us however the process is not simply a legal requirement but a process that allows us deliver the excellent service to our customers that we are striving for. By getting the best possible understanding and assessment of public safety across Kent and Medway, and all the things that we think could reasonably predict happening that could cause injury or loss of property, allows us to focus our services and response in the areas of greatest need.
Risk profiling is part of our planning cycle, which works across a four year period, but the information is reviewed on an annual basis to ensure it remains current and fit for purpose. The profiling of risk covers all three areas of response, prevention (largely our work in people’s homes and on the roads) and protection (largely in business premises and residential homes with common spaces like landings, such as a high rise building). Common approaches and datasets are used to ensure consistency across the business.
There are many elements to this process, but these are not considered in isolation as individual elements, we bring them all together to understand how best to deliver our services. This document focuses on the risk, demand and isolation elements, primarily in relation to changes to front line emergency response but it will demonstrate how this links through all relevant teams in the organisation.
| Risk: A combination of the likelihood and consequences of hazardous events | |
|---|---|
|
Hazardous event |
A potential event that can cause harm |
|
Likelihood |
The chance of something happening. May be described by the probability, frequency or uncertainty of events |
|
Consequence |
The outcome of an event. Specifically the severity or extent of harm caused by an event |
Risk
We need to establish how many people live in the area using census data. Using profiling data, we can assess how many people may have the needs we’ve identified in our impact assessments, and in what areas we might see certain groups of people. Some examples may be areas where we find more of one particular minority group who need additional support, or an area with a higher density of high-rise buildings. This helps us work out whether we need additional resources in certain areas.
We keep under review big questions such as population change and demographics. More people are living longer, but some have significant health issues.
Climate change is an area of concern for us as longer hotter summers lead to more outdoor fires. We also look at seasonal changes and how the risk may change in an area due to tourism or seasonal agricultural workers as examples.
How we profile risk of accidental fires in the home
We have developed our own statistical model over the last two years which provides us with the ability to estimate demographic risk in relation to accidental fires in the home. Using information available to us on the population in our area from Mosaic (a lifestyle profiling tool) alongside the most recent three years data on incidents and casualties allows us to segment and profile our customers and estimate the level of predicted risk of a fire in the home for each output area in Kent and Medway. An output area is a geographical area created for Census data collation and has on average 125 households within it.
The model is essentially a method by which an estimate of risk to life from a fire in the home is calculated and assigned to each of the 12 socio-demographic Mosaic Groups. This estimate is then apportioned to output areas based on the segmentation of households, providing an overall estimate of life risk in an output area (which can be aggregated to higher geographies). In addition the model will also indicate variations of the highest socio- demographic risk group in different areas. The model outputs can be used in more than one way, for example if we wanted to target a particular characteristic of a socio-demographic group we could filter on areas where they are the highest risk.
The model is refreshed on an annual basis and validation is carried out in the form of comparing actual incident data for the previous year to what the model predicted. The latest validation carried out found that on 70% of incidents, the Mosaic group of the household matched the two highest risk Mosaic groups the model predicted. Broadening the groups to include the highest three or four groups the model predicted, achieved a higher percentage still which suggests that targeting the high risk groups in areas where incidents have not yet happened is a proportionate approach to proactively targeting potential risk groups.
The benefit of this approach is it allows us to recognise and demonstrate knowledge of local diversity, rather than applying a blanket set of risk factors across the whole of Kent and Medway. Our previous approach was based on census data and numbers of lone pensioner and rented households, which had the limitation of not distinguishing between affluent or social lone pensioners or social/private rented households. Using Mosaic allows a greater level of granularity to profiling our demographic makeup of communities and updates are released annually resulting in a model that is more reflective of our communities.
We make sure that this information is utilised across the Service. Using the outputs of this model at Kent/Medway level, we take the highest risk groups into consideration for both reviewing where our fire engines are based and how quickly they can respond and for targeting where our firefighters carry out home safety visits in their local communities.
When we review the locations of our fire engines or how we crew them, we will use this model as one element of assessment. It will help us to identify if any areas where the risk (the likelihood and consequence of an event) of fire in the home is greater will be affected by the changes we are proposing. In an ideal world, we would be able to respond to an emergency across the whole area within a few minutes. In reality however, this would require a fire engine available 24 hours a day, 7 days a week in every town and village, which is neither affordable nor proportionate to the risk. We do however have to ensure that any change to our emergency response does not put residents already at a high risk, at further risk and increase the consequence of an event due to an extension in our response.
We provide our firefighters with prioritised addresses to visit in their local areas in order to offer home fire safety visits to those considered at greater risk of a fire in the home. In order to do this, we identify addresses that have a Mosaic group that matches the top four highest risk groups across the county or addresses that are provided through Exeter data. Exeter data is provided annually from the NHS and details the addresses of anyone over the age of 65. The model does not specifically take into account age but it is important that we continue to consider the age of our communities in relation to risk of a fire in the home; our fatalities are generally those over the age of 70 years and they remain a high-risk group to us.
How we profile risk of fires in non-residential buildings
Our Building Safety team is responsible for enforcing the Fire Safety Order 2005 across the County. There are in excess of 100,000 premises that fall within the scope of the Order and it is clearly unrealistic to visit them all, therefore resources must be prioritised to those where the risk is greatest. For that reason we have a methodology to identify those premises which we refer to as the risk based inspection programme.
We define high risk premises as “those premises where people sleep or a licence (issued under the Licencing Act 2003) is in force and data suggests they are likely to have fires or any premises where intelligence indicates a perceived likelihood of an incident occurring”.
There are three criteria to identify buildings for the risk based inspection programme which are:
- Buildings that fall into the top 5% of properties classified as high risk from the Experian Fire and Rescue Service Scored Risk Data; a commercially available database
- All specialist housing; the Experian data highlights that these types of properties are two times more likely to have a fire than the countywide average
- Tall residential buildings; those over 10 floors where the Experian analysis has highlighted a premises to be twice as likely to have a fire as the countywide average
In order to understand the risk that non- residential buildings present to us we utilise the Experian Fire and Rescue Service Scored Risk Data which is a commercially available database of buildings in the county. The dataset predicts the likelihood of a fire occurring at a premises and displays the information in a relative scale from 1 to 100. The methodology is statistically proven to predict that 80% of non-domestic fires that will happen will occur in the top 20% of highest risk buildings provided. The primary purpose for this dataset is to inform our risk-based inspection programme, but it also utilised as our master dataset of these buildings across the county. In addition it is also used by our Risk Information Team to target those buildings where we need to gather, record and manage risk information for effective firefighting and keeping our crews safe in the event of an incident.
To ensure we assess any changes to our front line response against the risk of fire in a non- domestic building, we have a model which simply takes the risk score provided the Experian data and aggregates the total score of all buildings within a defined area. This approach allows us to identify concentrations of buildings with a higher risk of a fire and consider this when we are reviewing where our fire engines are based and how quickly they can respond, exactly as we would for fires in the home.
In essence, one single dataset is providing risk information across all teams who need to utilise it allowing a consistent and coherent approach to this element of the community we serve.
How we profile risk of road traffic collisions
 Profiling the risk of when and how often road traffic collisions will happen is considerably more difficult than profiling risk of fires in buildings. There are many factors that affect road traffic collision profiling, not least of which the ability to profile the drivers involved in these incidents. To understand the risk and likelihood of road traffic collision incidents we assess differences in road infrastructure, such as A and B classified roads, and use historic incident and casualty data to determine the levels of our interaction with these incidents. This allows us to identify the areas where incidents are more likely to occur and consider these when assessing our response approach.
How we consider response against these risks
Our response model aims to provide a comparison of the estimated response times for our current fleet of fire engines to each output area across our area. The model provides a base case to benchmark the estimated response of the first and second fire engines allowing us to assess the impact of changes we may want to make.
Additionally, we can take this response model and combine it with one of the risk models detailed above, allowing us to assess any areas at greater risk due to a longer response time predicted.
Demand
We use a wide range of data to help us understand and quantify where we need our resources. We use data from all the incidents we have attended over the previous five years, look at key risk sites, and study local development plans from local authorities and the growth and infrastructure plan to look at where new demand may occur. A five year period of historic incident data is considered to be sufficient a time frame to allow for peaks and troughs in incident demand influenced by external factors.
Our historical data tells us where incidents have happened and sadly the people who have died or been injured in fires to note any trends or issues. Historic incident data is in fact ‘realised risk’ and is factored into our risk profiling models. We will look at individual incident types across areas as well to determine if any areas are over or under represented for incidents of a serious nature.
It is important not only to take into account incidents, but also to look at how busy our fire engines are, where they are being used and how they are being used. We review all occasions of simultaneous demand of our front line vehicles so we know how often multiple resources have been in use at one time and how long for. During the daytime we have fewer fire engines available, due to the availability of our on call staff, which can mean that relatively few incidents that are small in nature can deplete the fire engines we have available to cover the risk in the rest. Conversely, one large fire can have the same affect and last for many hours. In this scenario however we would put our resilience planning into effect, but it must be considered when looking at changes to emergency response cover models.
Our historic data allows us to assess the business as usual impacts on our resources, but it is also important that we consider those events which require wider scale planning for. All emergency services, local authorities and utility companies work together to keep our communities safe. We meet in what is known as the Kent Local Resilience Forum, one of our duties under a piece of legislation called the Civil Contingencies Act 2005. Part of the work of that group is to create and maintain a document called the Community Risk Register. This allows us to share data and information on our preparedness on the major risks in our area and then to determine how we would work together to prevent incidents, manage incidents when they occur and communicate with you.
Alongside all this data we also keep a live record of special risks such as historical buildings, waste recycling plants, big industrial sites, new housing estates being built and areas of natural beauty/ wildlands. We also monitor emerging concepts such as dementia villages which are starting to be developed in our communities.
Isolation
The geography we have in Kent and Medway makes a fundamental difference to how we provide services - we look at how long it would take us to reach very rural areas, areas of high population density, areas of deprivation and then marry these to the historical data about types and numbers of emergencies. This doesn’t totally predict the future but it can guide us about the type of equipment we need in different areas. Another factor that needs to be taken into account is the amount of time it would take a second fire engine to arrive to a location, known to us as fire engine lag. Obviously the quickest response possible for the first fire engine is incredibly important and with the geography of Kent there will always be places that we cannot get to within our 10 minute target for life threatening incidents. Getting to incidents quickly matters. The sooner we arrive, the sooner we can help. The sooner we arrive, the less severe and potentially life-changing any burn injuries may be. The sooner we arrive, the less severe any property loss may be, be it in someone’s home or their place of work. And the sooner we arrive the better the chances are of us performing a successful intervention if we need to. While one fire engine arriving can make a significant impact and will start to bring order and calm to the situation, there are many incidents which will need the staff and equipment from at least one other fire engine to bring the incident to a successful conclusion. Any proposed changes to front line service provision will assess any impacts on the time it takes for a second fire engine to arrive into an area.
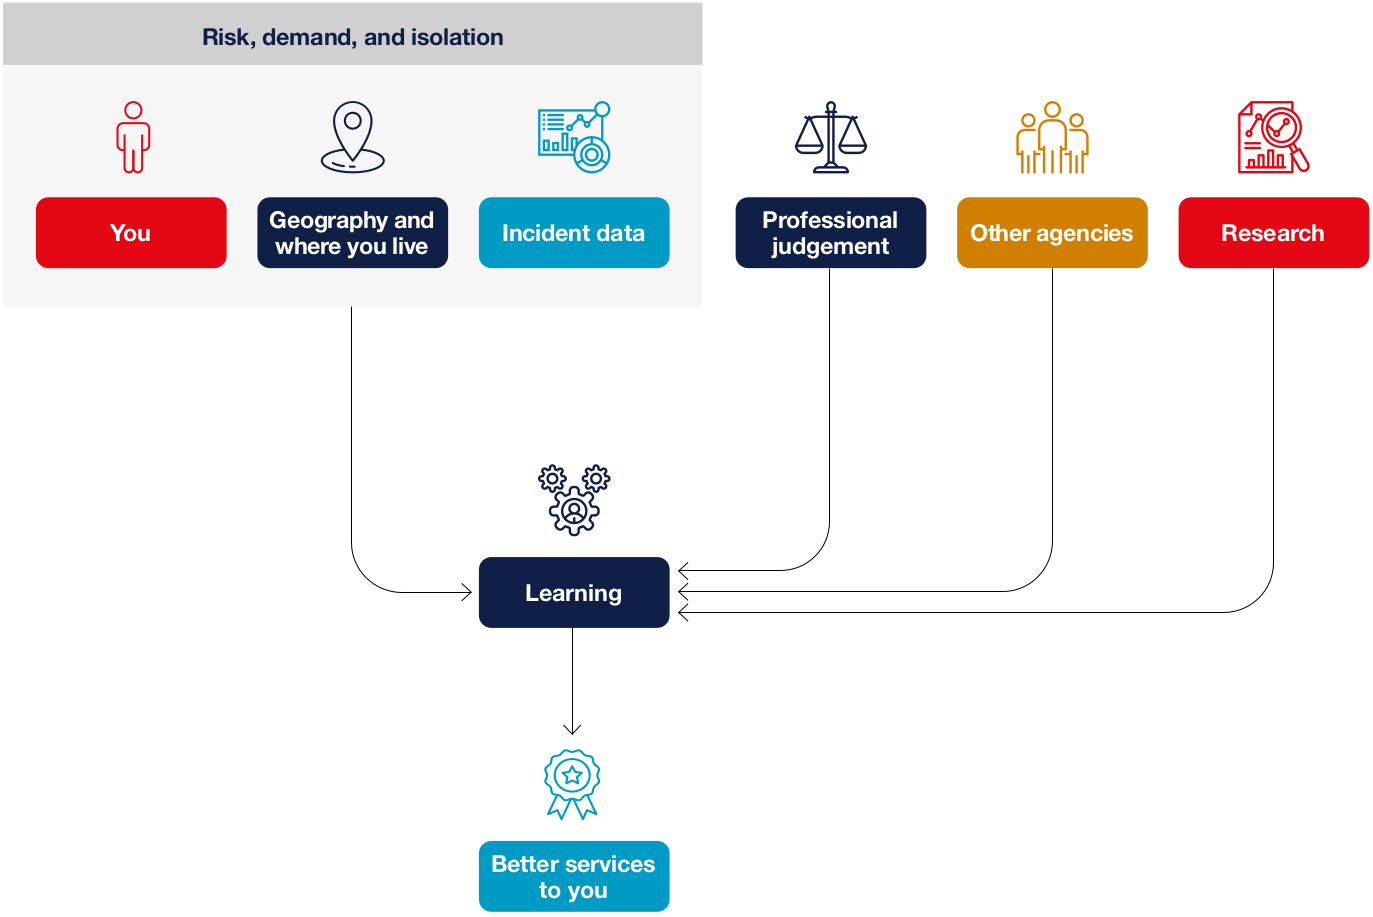
How it all works together
All these elements come together to help us serve you better. In summary we approach assessing changes to emergency response provision by considering all the elements through a three phased approach of risk, demand and isolation. There is no mathematical formula that weights these three things more important than one another, each is taken on its own merit and is therefore different across different geographical areas. This is our preferred approach because it allows us to truly assess our communities and not allow characteristics of one area overshadow the needs of another.
Professional judgement is key when considering making any changes to emergency response. We use a lot of data and information to create intelligence, but this approach will only take you so far, opinions of subject matter experts is incredibly important to sense check predictions against the real-world scenarios. The three areas of response, protection and prevention are all working to the same definitions of risk and services are being tailored to ensure we meet the needs of our customers and protecting those who are deemed to be at greater risk through the use of data, intelligence and professional judgement and understanding.